Handheld optical 3D scanners in reverse engineering
![]()
![]()
Review | Revisión
Lucas García Menéndez; Manuel Domínguez-Somonte y María del Mar Espinosa-Escudero
Escuela Técnica Superior de Ingenieros Industriales (ETSII) de la Universidad Nacional de Educación a Distancia (UNED). Juan del Rosal 12, 28040 Madrid.
Received: 14 February 2021 | Acepted: 2 May 2021 | Published: 29 de junio 2021
DOI: https://doi.org/10.25267/P56-IDJ.2021.i1.3
Introduction
In the field of mechanical design, reverse engineering refers to "the initiation of a redesign process, in which a product is observed, disassembled, analysed, tested, "experienced" and documented in terms of its functionality, form, manufacture and assembly" (Otto & Wood, 1998). While this process can be carried out by conventional techniques, reverse engineering has become popular thanks to the development and proliferation of Computer-Aided Design (CAD) and 3D scanning techniques. While conventional engineering transforms concepts and models into real components, in reverse engineering real components are transformed into models and concepts (Várady, Martin & Cox, 1997).
Today's reverse engineering processes can be resumed in two steps: (1) data acquisition (measurement) and (2) surface reconstruction (Ameen, Al-Ahmari, & Mian, 2018). The goal of data acquisition is to collect both structural and dimensional information of an existing object. The results are usually represented as a point cloud (Figure 1).
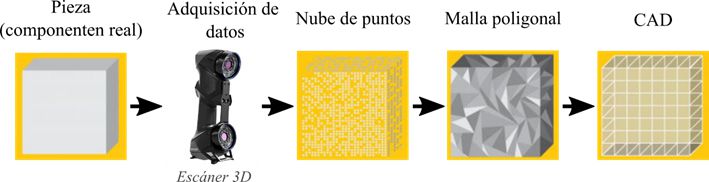
Figure 1. Typical reverse engineering process in the field of mechanical design [5].
The surface reconstruction phase includes pre-processing the point cloud to filter out noise, connect adjacent points, reduce redundancy and merge point clouds taken from different viewpoints; segmentation of the point cloud to fit the subsets resulting from the segmentation to surfaces; and finally, construction of the geometric model (Várady, Benkő, Kós, Renner, & Weiß, 1999).
Data acquisition in reverse engineering processes
Different data acquisition techniques are available depending on the specific needs of each application and the desired accuracy. It is worth mentioning that the accuracy of the data obtained has a great impact on the subsequent steps of the reverse engineering process. An imprecise measurement can lead to inaccurate results and ultimately to a failure of the reverse engineering process. Therefore, it is crucial that the data acquisition method is appropriate for the specific application (Ameen et al., 2018).
Data acquisition techniques can be divided into contact and non-contact techniques. As the name suggests, contact techniques involve a probe touching the surface of the object (Figure 2).
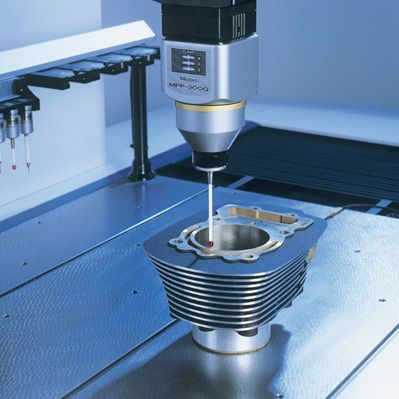
Figure 2. Coordinate measuring machine (CMM).
Non-contact techniques can be divided into two categories: active and passive (Figure 3). Active techniques base their operation on the emission of some kind of radiation, such as light (optical methods), sound (sonar) or X-rays. To obtain information about the target body, the reflection of the emitted radiation is detected. In the other hand, passive non-contact data acquisition techniques rely on instruments that do not emit any radiation themselves, but are based on the detection of ambient radiation. Due to its easy accessibility, light is often used as ambient radiation.
An example of a passive non-contact data acquisition technique is photogrammetry, which retrieves three-dimensional information about an object from a series of photographs of the object. When working with one photo, information on the geometry of the object, i.e. two-dimensional information, can be obtained. If you work with two photos, in the common area between them (overlap area), you can obtain stereoscopic vision; in other words, three-dimensional information. Photogrammetry techniques are based on this basic principle.
For applications in the reverse engineering field, non-contact, active and light-emitting (optical) data acquisition techniques are commonly used. Devices based on such techniques are called optical 3D scanners (Kuş, 2009).
Figure 3. Summary of data acquisition techniques in reverse engineering.
In the field of reverse engineering, due to the small size of the objects to be scanned, the devices must be light and easy to carry and handle, reason why handheld scanners have proliferated. In other applications, such as architecture and surveying, the main requirement is for the scanning range to be very wide. These devices often rely on LiDAR technology (see below), are large and require a tripod to maintain a static position.
Handheld laser scanners
Most handheld laser scanners are based on one of the three optical techniques shown in Figure 3: triangulation, structured light and, to a lesser extent, LiDAR. In the subsequent section, the performance of these three technologies is detailed and the main features and specifications of the most advanced devices in each category are discussed.
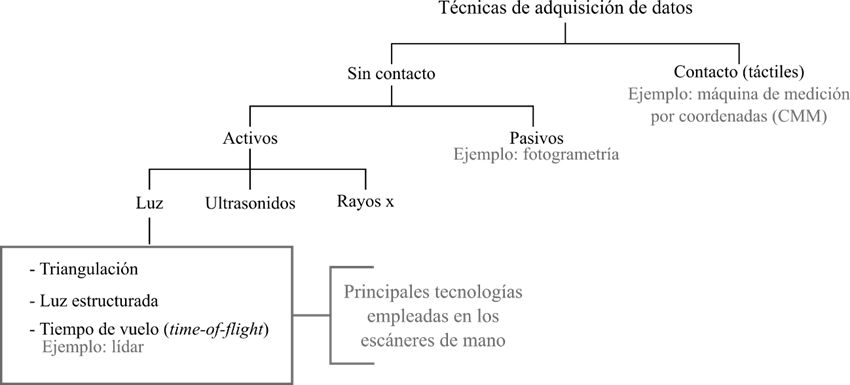
Figura 3. Resumen de las técnicas de adquisición de datos en ingeniería inversa.
Triangulation
In this method, a laser beam is projected onto the subject and, thanks to a camera, the location of the point where the beam hits the surface is detected. Based on the distance from the source to the surface of the object, the point is reflected at different locations on the camera's sensor. This technique is called triangulation because the point of the object where the laser hits, the camera and the laser source make a triangle (Figure 4).
Both the length of side a of the triangle (distance between the camera and the laser source) and the angle at the vertex where the laser source is located (α) are known. In addition, the angle at the vertex corresponding to the camera position (θ) can be determined given the location of the point where the laser is hitting the object. These three data completely define both the shape and size of the triangle and provide the location of the vertex corresponding to the point of contact between the laser and the object (França, Gazziro, Ide, y Saito, 2005)(Li, Wang, y Fu, 2016).
The coloured lines in Figure 4 show how the reflected laser hits different points on the camera sensor depending on the distance between the laser emitter and the surface of the object. The point where the reflected laser hits the sensor (camera) depends on the vertical position of the object relative to the laser source/camera assembly. As shown in Figure 4, the variation of the vertical position of the object (d) produces proportional changes in the position where the laser is reflected (d').
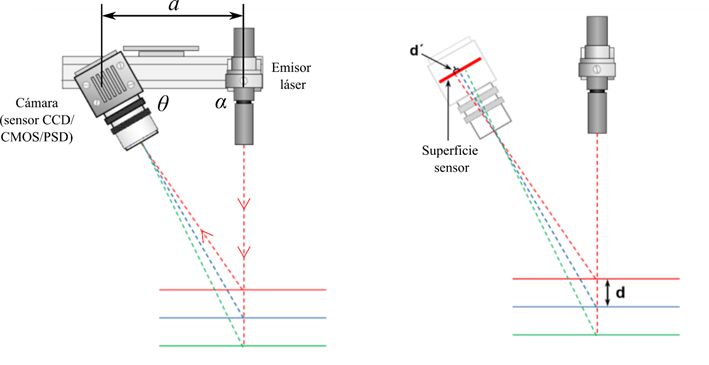
Figure 4. Diagram of laser triangulation (Alexandrea, 2017).
The triangulation method is an effective way of calculating the distance between the sensor (camera) and a point on the object. If several points are measured, it is possible to obtain information of a profile or an area, but this would be a time consuming and inefficient process. For this type of applications, there exist systems that project one (or several) laser line(s) onto the object surface (Figure 5). The laser line reflected from the sensor provides a cross-section view of the object to be scanned (MoviMED, s. f.).
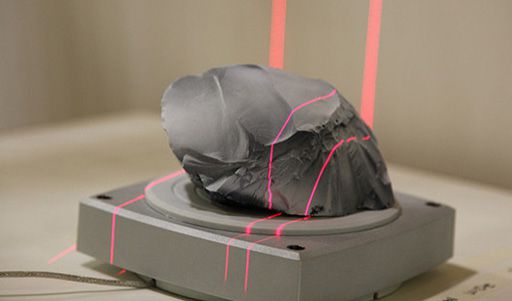
Figure 5. Triangulation scanning (Alexandrea, 2017)
Triangulation-based scanners are widely used in reverse engineering and heritage reconstruction. It should be mentioned that these devices have a small scanning range and are therefore suitable for close objects. In (Lv et al., 2018), the Creaform EXAscan scanner is used to capture a teapot. Due to the geometry of this object, accurately capturing its shape using traditional methods would be very difficult, thus highlighting the potential of laser scanning techniques in the field of reverse engineering. In (Ion et al., 2017), the same device is used for the reconstruction of the complex stuccoes of the Nanu-Muscel building in Bucharest.
The main advantages of laser triangulation are high resolution and accuracy in short distances. In addition, the devices that are used in this technology are simple in design, so they tend to have a lower cost than the rest. It should be pointed out that the properties of the surface to be scanned have a great impact on the process. Very shiny or transparent surfaces can be problematic and compromise the quality of the acquired data. The challenge of scanning shiny surfaces is common to all scanners, regardless of the technology on which they are based.
An example of a scanner based on this technique is the Creaform HandyScan BLACK Elite (Figure 6). Developed by the Canadian company Creaform in 2019 (Creaform, s. f.), This device is part of the Handyscan line of handheld scanners. It projects eleven blue laser crosses onto the object to be scanned. In addition, it has a single laser mode that allows scanning difficult-to-access areas such as holes and cavities.
One of the most remarkable features of the HandyScan BLACK Elite is its ability to create a mesh of the scanned object in real time. In this way, the user has an optimal overview of the progress during the scanning process. In terms of its technical specifications, it has a data acquisition rate of 1,300,000 points per second and can scan parts between 0.05 and 4 m with an accuracy of 0.025 mm.
Figure 6. Creaform HandyScan BLACK Elite
Blue lasers provide better results when scanning objects of certain materials or surface finishes. For example, hot metals emit light at wavelengths at which red lasers operate, making it impossible to achieve stable measurements. In some cases, the light emitted can be so strong that the laser measurement fails completely. However, the wavelength of blue lasers is shorter (Figure 7), so they are further away from the red part of the visible spectrum. As a result, it is unaffected by the light emitted by the metal, resulting in a more stable measurement.

Figure 7. Spectrum of visible light perceived by the human eye [14].
When scanning organic, transparent or translucent materials (e.g. plastics), red lasers penetrate deeper into the surface of the object, creating an unfocused and blurred dot. This results in an inaccurate and unreliable measurement. Due to its short wavelength, blue laser does not penetrate the object, projecting a very small, focused dot that provides a stable and accurate measurement.
Finally, blue laser is preferable when scanning polished or shiny surfaces. On these surfaces, red light is distorted and increases the noise of the detected signal. Again, the short wavelength of blue light is the reason why it works well.
However, the higher strength of red lasers makes them suitable for scanning matt surfaces or moving objects (Jones, 2016).
Structured light
Scanners based on structured light are equipped with one or more cameras and a projector, which emits a pattern (in most cases a striped pattern) onto the object to be scanned. The surface of this body deforms the projected pattern, in such a way that the stripes adapt to the curvature of the object (Figure 8).
The scanner, through the cameras, captures the deformed pattern and produces a 3D model out of it. Depending on the thickness of the stripes, the scanner determines the distance to a point of the object, because the further away the object is, the thinner the stripes are. On the other hand, the closer the object, the thicker the stripes are in the deformed pattern. To improve the accuracy and quality of the measurement, several patterns with different compositions are projected onto the object (between 3 and 10 different patterns per viewpoint).
One of the main disadvantages of this scanning technique is that it is not suitable for objects with reflective surfaces. The way incident light reflects on the object to be scanned is the main source of information in this type of scanner, so any unexpected interaction between the light and the object will cause problems in data acquisition. Transparent surfaces can cause loss of detail in the model, and reflective surfaces can cause light to reflect away from the camera (Wang & Feng, 2016).
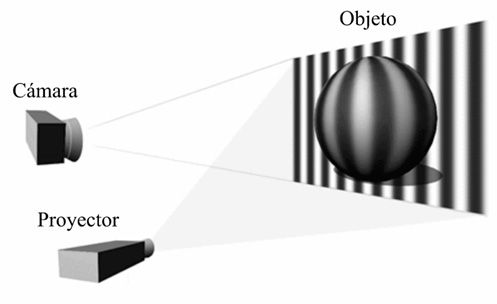
Figure 8. Overview of structured light technology.
In comparison to laser triangulation, structured light offers a higher scanning speed. Due to the fast data acquisition, these devices are less prone to inaccuracies due to environmental disturbances. The main disadvantage of this technology is its high sensitivity to ambient light conditions, which makes it difficult to use them outside.
An example of this technique is the FARO Freestyle 2 (Figure 9). Introduced in 2020, the Freestyle 2 is the latest model in FARO Technologies' line of handheld scanners (FARO, s. f.).
This device features: a laser projector that emits a grid of dots (matrix), two cameras to read the grid of dots, a colour camera to capture the frames and 3 LEDs to illuminate the environment. In addition, it requires the user to carry a small mobile computer.
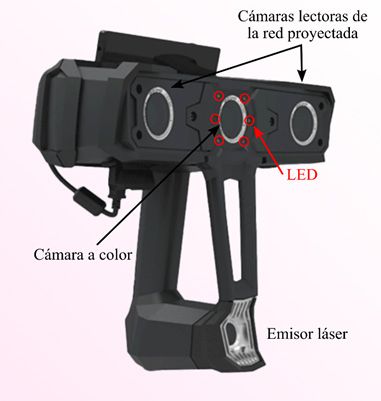
Figure 9. FARO Freestyle 2.
LiDAR or Time of Flight (ToF)
A LiDAR (Light Detection and Ranging or Laser Imaging Detection and Ranging) is a device that, thanks to a pulsed laser light beam, is able to determine the distance from a laser source to an object or surface.
This technology is based on time-of-flight calculation. The distance is obtained by measuring the time taken by the light beam from its emission until it bounces off the surface and is detected by the sensor. From this time, and taking into account that the speed of light is a known constant, the distance between the laser emitter and the object is obtained.
LiDAR technology offers a very wide scanning range hence it is often used in larger non-portable scanners. However, over the last few years, some handheld scanners that employ LiDAR technology have been released to the market.
Since the scanning range of LiDAR-based devices is much larger than those using the previous technologies, they are widely used in fields such as surveying, engineering, architecture and construction.
Unlike laser triangulation scanners, LiDAR measures the distance to a single point at a time. To scan all the points in its range, the scanner shifts the laser to form a 360° dome horizontally and 270°-300° vertically.
As previously mentioned, LiDAR scanners measure the time that it takes for the light beam to bounce off the surface and be detected by the sensor. When objects are close to the source, this time is very small and therefore difficult to measure. This is why, for scanning close objects, they are less accurate than devices based on laser triangulation or structured light.
An example of this technique is the Leica BLK2GO (Figure 10). Founded in Switzerland in 1819, Leica Geosystems is a company that operates in the fields of metrology and surveying. Leica Geosystems has only one handheld scanner in its catalogue, the Leica BLK2GO. This device, launched in 2019, captures images and point clouds in real time. It combines a dual-axis LiDAR system with simultaneous localisation and mapping technology, which allows it to record its motion path. It comprises a set of algorithms that process data captured from multiple sensors (sources of information), such as: inertial measurement units (which are themselves composed of a combination of sensors), 2D or 3D LiDAR, imagery, etc. In the field of 3D scanning, SLAM algorithms combine and use the data collected from these information sources to register the position of the scanner and, at the same time, build a 3D point cloud of the scanned environment. Like most handheld laser scanners, this device does not require a geopositioning satellite (GPS) signal for its operation, allowing it to be used in extremely remote locations.
Leica BLK2GO combines an inertial measurement unit, a 12 Mpx camera and three 4.8 Mpx cameras that enable visual navigation, point cloud colouring and panoramic image capture (Piniotis, Soile, Bourexis, Tsakiri, & Ioannidis, 2020). This device's main advantage is its scanning range of 25 m (0’Neill, 2020). Out of the three devices discussed in this article, the BLK2GO has the longest range.
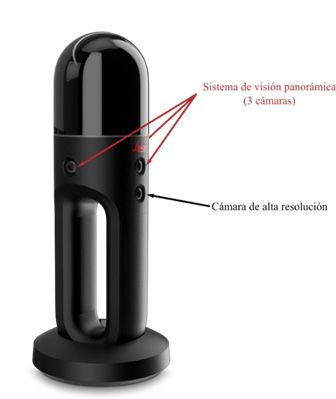
Figure 10. Leica BLK2GO.
The advantages, disadvantages and fields of use of the three technologies are listed in Table 1 below.
Table 1. Analysis of the 3 technologies.
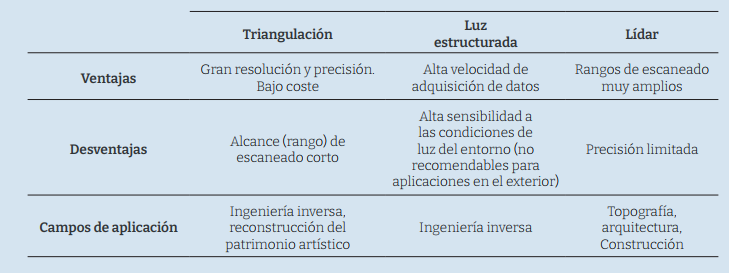
It is worth mentioning that the comparative analysis of Table 1 is only a rough guide, as there are devices that, despite using the same technology, have very different technical specifications. Therefore, Table 2 shows some of the most relevant characteristics of the three devices studied in this article.
Table 2. Analysis of the 3 devices.
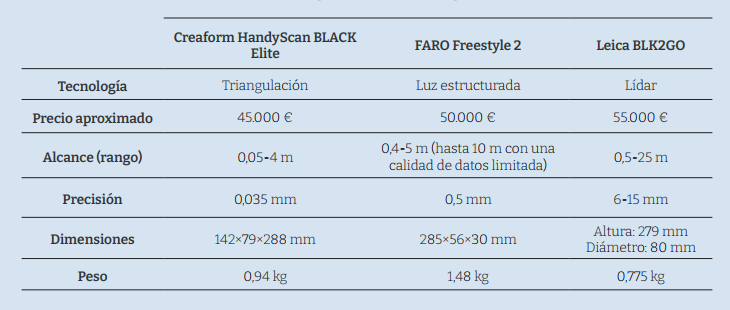
The scanners chosen for analysis represent, within each technology, some of the most advanced and outstanding options on the market. Obviously, this is translated into the price of the equipment. However, given the wide variety of scanners developed in the past few years, there are cheaper options that, depending on the application, can be considered. An example of a low-cost handheld laser scanner is the Peel 3D peel 2, which is priced at around €7,500. Based on structured light, it has an accuracy of 0.25 mm and a scanning range between 0.3 and 3 m.
Even though this article focuses on handheld optical scanners, it is worth mentioning photogrammetry as an alternative to laser scanning. Photogrammetry is a very popular data acquisition method in the field of reverse engineering since, from a hardware point of view, the main requirement is a camera.
Scanner positioning
The positioning method of a 3D scanner is the way in which a system captures three-dimensional space and aligns the data collected during different scans. There are several methods for determining the position of a 3D scanner. In the case of measuring arms, the position of the end of the arm (where the stylus or 3D scanning head is located) is determined by sensors (mechanical encoders) integrated into the arm. Measuring arms need to be fixed to a surface, i.e. they require a physical link (arm) to position their end (Figure 11a).
Other devices rely on optical systems to determine their position. These methods involve two elements: a fixed optical tracker mounted on a tripod and a 3D scanner that is manipulated by the user. The scanner is located in real-time thanks to the tracker's cameras. Although no mechanical link between the scanner and the optical tracker is required, there must always be a clear and direct line of sight between the two devices (Figure 11b).
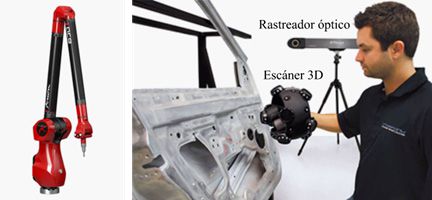
Figure 11. Measuring arm (a) and optical system (b).
Handheld scanners collect data in reference to an internal coordinate system. Since the scanner is in motion, it is necessary to determine the position of the scanner in order to be able to use the captured data. To this end, they use a self-positioning system. The device uses the object to be scanned as a reference for its positioning. Therefore, unlike previous positioning methods, no external device is required. This results in a reduction of the setup time and in better workability in complex or difficult-to-access environments.
Handheld scanners use cameras to achieve stereoscopic vision, i.e. they are able to integrate two images into one to create a three-dimensional image. This allows the device to determine its position relative to specific points, which may be positioning targets or object features. Additionally, there are hybrid positioning scanners, which combine the accuracy of positioning by targets with the flexibility of positioning by features of the scanned object.
In target positioning, alignment points are placed before starting the scanning process (Figure 12), either on the object to be scanned or, when the objects are too small, around the object. Targets are usually adhesive and have a simple geometry purposely designed to be detected by the scanner. The scanner determines the relative position of each detected target. To achieve accurate positioning, a minimum of 3 targets must be within the field of view of the device. As the scanner moves around the part, new targets are detected and registered in the global positioning model.
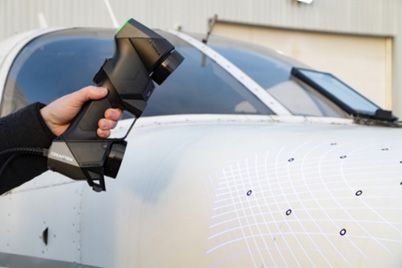
Figure 12. Positioning by targets placed on the scanned surface.
Some scanners use the features of the object to be scanned (its shape and texture features) for positioning. As data is acquired, the device detects and records shapes and textures in the scanned area. When scanning from another position, the detected features are compared with those previously recorded to match the captures and determine the position of the scanner. The features of the scanned object must be prominent enough to be detected accurately.
In addition, there exists a hybrid positioning method, in which the user compensates for the lack of features in a given object by adding positioning targets.
Target positioning provides the most accurate and reliable results, but the time involved in placing the targets must be taken into account. On the other hand, feature-based positioning is the quickest and simplest method, but the data obtained is less accurate [20].
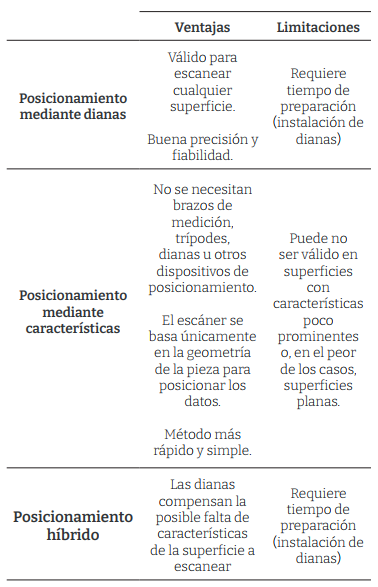
The advantages and limitations of the three self-positioning methods used in handheld optical 3D scanners are listed below (Table 3).
Table 3. Advantages and limitations of the three self-positioning methods.
Conclusions
Laser scanning techniques have a wide range of applications, of which reverse engineering is one of the most important. A fundamental part of any reverse engineering process is data acquisition. Thanks to the technological advances of the last few years, 3D laser scanning devices have become smaller, lighter and easier to use. The development of handheld laser scanners could be seen as the pinnacle development in device portability.
The present paper presents the three most significant laser scanning techniques: triangulation, structured light and LiDAR. It also includes examples of the most advanced handheld scanners currently available on the market. The state-of-the-art of this technology has been analysed by unifying the different working principles of the most relevant devices.
Considering the analysis carried out, it can be concluded that devices based on laser triangulation and structured light have very similar technical characteristics and therefore share the same field of application.
On the other hand, handheld scanners based on LiDAR technology have a greater scanning range (in mobile devices, it can be up to 250m), so their field of application are different from the previous ones. However, in a real case, it would be necessary to know the application in depth to determine which technology would be the most appropriate.
References
Alexandrea, P. (2017). The Complete Guide to 3D Scanners using Laser Triangulation - 3Dnatives. Recuperado 2 de mayo de 2021, de 3Dnatives website: https://www.3dnatives.com/en/3d-scanner-lasertriangulation080920174- 99/
Allard, P. H., & Lavoie, J. A. (2014). Differentiation of 3D scanners and their positioning method when applied to pipeline integrity. NDT 2014 - 53rd Annual Conference of the British Institute of Non-Destructive Testing, (418).
Ameen, W., Al-Ahmari, A. M., & Mian, S. H. (2018). Evaluation of handheld scanners for automotive applications. Applied Sciences (Switzerland), 8(2). https://doi.org/10.3390/ app8020217
Becerra, F. (2019). Patrones de Conducta Facial para Identificar Accesos Informáticos no Autorizados. https://doi.org/10.13140/ RG.2.2.11400.67845
Creaform. (s. f.).Creaform launches Handyscan black: the ultimate reference in portable metrology. Recuperado 2
de diciembre de 2020, de https://www.creaform3d.com/en/news/creaformlaunches-handyscan-black-ultimatereference-portable-metrology
FARO. (s. f.). FARO lanza el escáner 3D portátil Freestyle 2. Recuperado 2 de diciembre de 2020, de https://www.faro.com/es-es/news/faro-lanza-el-escaner-3d-portatilfreestyle-2/
França, J. G. D. M., Gazziro, M. A., Ide, A. N.,& Saito, J. H. (2005). A 3D scanning system based on laser triangulation and variable field of view. International Conference on Image Processing, ICIP, 1, 425-428. https://doi.org/10.1109/ICIP.2005.1529778
Ion, R. M., Gurgu, V., Bucurica, I. A., Teodorescu, S., Ion, M. L., Postolache, D., & Darida, I. (2017). 3D-Reconstruction of the Complex Stuccoes from Patrimony Buildings. Digital Presentation and Preservation of Cultural and Scientific Heritage, 7(September), 107-112.
Jones, C. (2016). Red vs Blue Lasers: A Comparison of Triangulation Sensors.Recuperado 27 de marzo de 2021, de https://www.automation.com/en-us/
articles/2016-2/red-vs-blue-lasers-acomparison- of-triangulation-s
Kuş, A. (2009). Implementation of 3D optical scanning technology for automotive applications. Sensors, 9(3), 1967-1979. https://doi.org/10.3390/s90301967
Li, X. Q., Wang, Z., & Fu, L. H. (2016). A laserbased measuring system for online quality control of car engine block. Sensors (Switzerland), 16(11). https://doi.org/10.3390/s16111877ç
Lv, S., Zhu, Y., Ni, H., Wang, X., Huang, T., & Zhang, J. (2018). Teapot three-dimensional geometrical model reconstruction
MoviMED. (s. f.). What is Laser Triangulation? Recuperado 12 de noviembre de 2020, de https://www.movimed.com/knowledgebase/what-is-laser-triangulation
Otto, K. N., & Wood, K. L. (1998). Product evolution: a reverse engineering and redesign methodology. Proceedings of the ASME Design Engineering Technical Conferences and Design Theory and Methodology Conference (DETC’96), 1-15.
Piniotis, G., Soile, S., Bourexis, F., Tsakiri, M., & Ioannidis, C. (2020). Experimental assesment of 3D narrow space mapping technologies. International Archives of the Photogrammetry, Remote Sensing and Spatial Information Sciences - ISPRS Archives, 43(B2), 149-156. https://doi.org/10.5194/